
EVE talks Sexual Attitudes

Inside
Tap any title and the pages will turn to it. The menu at the bottom of the screen jumps to any section.
A note on the quotes. Every quote in this edition was typed by a real Australian taking part in the 2021 study. We have corrected spelling, capitals and punctuation so they read easily, and changed nothing else. The conversation replay in Part Two is shown exactly as it was typed.
This printing: 2 November 2026, 5.15pm
Revisiting a foundational study that taught us about people and about qualitative AI

2026 marks the five-year anniversary of our study on sexual attitudes, as part of a wider initiative to explore people’s private thoughts through qualitative AI.
Five years on, we felt there was real value in going back to this data set and exploring it. First, because we feel, despite the passing of half a decade, the results are still both fascinating and relevant. Second, because a retrospective provides a grounded approach to comparing how we did qualitative AI before Large Language Models (LLMs) and how we do it now.
Fair warning, the report is a long read, but we hope you find it interesting, entertaining, shocking, sad, funny and revealing. That is, an enjoyable and productive investment of your time.
Above all else, we hope reading about the secret sex lives of Australians evokes thoughtfulness about an aspect of life that is central to our human experience but which many people find challenging to discuss and which has become, sadly, chronically associated with the porn industry.
This Directors Edition reassesses and analyses the original EVE conversations using the state of the art text analytics tools we have in HumanListening today with help from Claude using MCP. We have recoded every transcript against 28 themes, modelled what drives satisfaction and surfaced seven distinct sexual types. The first part of the report focuses on the actual results and insights.
The report then changes gears to look at how the 2021 EVE, which used Natural Language Processing (NLP) rather than LLMs, performed as a learning opportunity and to demonstrate how far EVE has come in her latest iterations.
We hope you find both sections interesting, if for different reasons.
Garreth Chandler
Founding Partner, The Evolved Group
Tracey Rankin
Director, Alchemy Research & Insight

Part One
What makes a happy sex life
Satisfaction with Sex
To explore sexual attitudes we surveyed 926 Australians using a research panel. This included up-front disclosure to respondents that we were going to ask them candidly about a sensitive topic. From there, EVE kicked into gear and the conversations flowed.
In August 2021, 926 Australians aged 18 to 98 gave their score and then typed their reasons. The initial screener questions on age, gender and where people live were followed by a scaled rating of ‘how sex makes you feel’, from 0, ‘extremely negative’, to 100, ‘extremely positive’. In this article, we call that score ‘sexual satisfaction’.
Immediately after this question, EVE, the chat engine, asked the respondent what it was about sex that made them feel that way. This included the text “I am not a real person, I am a bot, I have no emotions, I don’t judge.”
Here are two selected responses by way of example.
A woman aged 65 to 74 who had set it at zero wrote, “The thought of having sex is quite repugnant to me these days.”
A man of the same age who had set it at 99 wrote, “There is nothing nicer than waking up in the arms of someone you love, respect and admire.”
Most people sit somewhere between those two. Our goal is to understand the gulf between these two attitudes: what people at each level of sexual satisfaction talk about, what moves it up or down, and the seven quite different sexual lives that appear when you listen closely.
“I feel good when having sex with my partner as I feel that is when he really looks at me in a different way and I feel really wanted.”Woman, 35 to 44 · satisfaction 90
I. A spectrum of sexual satisfaction
Most people feel positive about sex. The average score was 71, and about one in eight people gave sex a perfect 100. We call the people who rated 81 or higher ‘satisfied’ and they make up a little under half the sample.
The tail is long, though. About one in seven rated sex at 40 or lower, and half of those at 20 or below. We call them ‘unsatisfied’, and six in ten of them are women.
A single score is a blunt instrument. It tells you where someone stands and nothing about why. The ‘why’ came from the conversation. Each person was asked what it was about sex that made them feel the way they did, and EVE followed up two to five times on what they said. Together they typed 48,857 words. In 2026 we coded every conversation against 28 themes, from physical pleasure and intimacy to low desire, grief, tiredness and pain, without looking at anyone’s score. For the record, The Great Gatsby has a similar word count, but the language is a little more coy.
“Having a responsive partner who is interested in what I like, not just their own needs.”Woman, 25 to 34 · satisfaction 100
Laid out along the scale, the themes tell a story in four scale regions. At the bottom people talk about what has stopped. In the middle they talk about what is fading. Cross into positive territory and the talk turns to what is shared. Only at the very top does it become, mostly, about what is enjoyed.
The people at zero are not simply less enthusiastic versions of the people at 100. They are describing different problems, and often different lives. Only about one in eight of those who rated 20 or below were having sex with a partner, and most were single. Among those who rated 81 or higher, three in four were.
Desire is the thread that runs through the lower half. Four in ten people below 60 raised low desire, more than any other theme, often alongside ageing, health or a partner who was no longer there. In the upper half it almost vanishes. What replaces it is closeness, relief from stress, love and, at the very top, pleasure for its own sake.
“How the hell are you supposed to feel sexy in a body acting like an enemy?”Woman, 35 to 44 · satisfaction 33
The next pages walk up the scale one band at a time, with what the people in each band said most often and, in their own words, how it feels to be there.

A2“…move the slider to the image that best expresses how you feel about having sex.” 0 extremely negative to 100 extremely positive
The majority falls into the range from 60 upward and peaks in a tower at 100. Below 40 the squares thin out and there is a small cluster at the very bottom: 29 people rated sex at 4 or lower, 14 of them at exactly zero.
The colours carry through the rest of our analytical reporting. Red and orange mark the unsatisfied end of the scale, grey the middle, and mint and teal the satisfied end.
A2“…move the slider to the image that best expresses how you feel about having sex.” 0 extremely negative to 100 extremely positive
bySplit by age, gender, relationship, orientation, kids at home and location (S1 to S3, D1, D1a, D2)
A2“…move the slider to the image that best expresses how you feel about having sex.” 0 extremely negative to 100 extremely positive
bySplit by age, gender, relationship, orientation, kids at home and location (S1 to S3, D1, D1a, D2)
Who is happiest
Sexual satisfaction is not spread evenly. The happiest group in the survey is couples who live apart, with a median of 86. Next come 18 to 24 year olds at 83, people aged 35 to 44 at 82, and men and parents with kids at home, both at 81.
At the other end are people aged 75 and over, with a median of 65 and almost a third unsatisfied. Single people sit at 69, 65 to 74 year olds at 71 and women at 73.
Some of these overlap. Couples who live apart and parents with kids at home are younger, with median ages of 35 and 40. Allow for age and most of their lead shrinks. Being single, being a woman and being over 65 each still cost around ten points or more after the others are taken into account.
Sexual orientation makes no measurable difference. Heterosexual, gay or lesbian and bisexual respondents had medians of 77 to 80 and much the same spread, though only 35 and 46 people answered as gay or lesbian and bisexual. Living in a capital city or a regional area made no real difference either.
“I am recently widowed so I’m not currently having sex with another person. I’m still in love with my husband and my bedroom wall is covered with photos of him and his penis, and that is a lovely thing to wake up to and go to sleep to.”Woman, 55 to 64 · satisfaction 100 · from the fulfilment chat
B1“Please share with me what it is about sex that makes you feel this way?” EVE’s opening question, then two to five follow-ups, coded against 28 themes
bySplit by satisfaction (A2)

“The thought of having sex is quite repugnant to me these days.”Woman, 65 to 74 · satisfaction 0

“I just have no interest in it at all.”Man, 65 to 74 · satisfaction 21

“Used to feel very fulfilled, but since my husband died it is now just a response to a physical need.”Woman, 75+ · satisfaction 60

“Something that helps me relax, makes me feel fulfilled and close to my partner.”Man, 45 to 54 · satisfaction 67

“Having a responsive partner who is interested in what I like.”Woman, 25 to 34 · satisfaction 100
B1“Please share with me what it is about sex that makes you feel this way?” EVE’s opening question, then two to five follow-ups, coded against 28 themes
bySplit by satisfaction (A2)
A3“Below are some factors related to sex. Please use the scale to indicate your feelings about each of them.” Very positive to very negative
bySplit by satisfaction (A2)
II. Did the Earth move for you? Drivers of sexual satisfaction
There are two ways to ask what makes a sex life satisfying. You can ask people to rate the parts of it, using traditional rating scales, or you can let them tell you using qualitative AI. The 2021 survey did both.
Let’s start with the ratings. We asked people to rate five aspects of their sex life: how often they have sex, how fulfilled they feel, how comfortable they are talking about it, their energy for it and their confidence. The satisfied group on the overall rating were positive about all five. The dissatisfied group were positive about almost none.
The widest gaps were not where you might expect. Three quarters of the satisfied felt good about their energy for sex and about their sexual confidence. Among the unsatisfied almost nobody did. Frequency, the thing people most often joke and worry about, was the weakest of the five, well behind energy and confidence.
“I am so tired all the time it’s the last thing on my mind.”Woman, 35 to 44 · satisfaction 27
“once i start having sex again my energy levels increase not just sexually but for every day energy use”Woman, 25 to 34 · satisfaction 100
A1“Our first question is to understand the range of sexual activities that you partake in. Which of the following applies to you?” Tick all that apply
bySplit by satisfaction (A2)
We also asked people what sexual behaviours they partook in. Two thirds of the satisfied had been sexually active in the previous three months and two thirds said they orgasm during sex. Among the unsatisfied it was about one in six for both, and more than four in ten said none of the listed activities applied to them at all.
Men and women differ here too. Men were twice as likely as women to watch porn and three times as likely to have casual sex. Women were more likely to use sex toys.

“That I still have the desire as post-menopausal and can achieve orgasm.”Woman, 65 to 74 · satisfaction 97
D3“How often do you typically have sex with another person, excluding masturbation?” Asked of anyone who ticked a partnered activity in A1
A2“…move the slider to the image that best expresses how you feel about having sex.” 0 extremely negative to 100 extremely positive
D1“Which of the following best describes your personal situation?”
A2“…move the slider to the image that best expresses how you feel about having sex.” 0 extremely negative to 100 extremely positive
Frequency may not be the main thing, but it matters, in a steady way. Among people who have sex with a partner, those who have it more often rate it higher, from the high sixties for every few months or less to the mid eighties for weekly or more. But plenty of people are content with less: “Im happy with the amount we are having and the type, to be honest I don't have the energy for any more” Relationships matter too. Single people were the least likely to be satisfied and couples who live apart the most likely, with married people in between.
Then there is what people said. When we modelled sexual satisfaction on the 28 coded themes from the EVE conversations, the themes alone explained about half of the variation in satisfaction, and almost as much when tested on people the model had not seen. That is a great deal of signal from an eight minute survey, with the added benefit of not pre-empting the drivers of sexual satisfaction.
The single heaviest weight is low desire. People who raised it sat 18 points lower on sexual satisfaction, all else equal, and it carries more of what the model explains than any other theme. Next comes a dislike of the act itself. Fewer than thirty people said so, but they sat 36 points lower. Physical pleasure is the biggest lift, worth about 8.5 points to those who talk about it.
Some themes are common and gentle. Intimacy and closeness came up in almost a third of conversations and lifted sexual satisfaction by about 5 points. Others are rare and heavy. Sexual dysfunction, losing a partner and past trauma or bad experiences each came up in fewer than one conversation in twenty, and each pulled sexual satisfaction down by 16 to 20 points.
There is a common belief that marriage spells the end of sexual enjoyment, but our results suggest otherwise. The interesting twist is that couples who live apart seem to have the best sex lives, though partly because they are younger, and being single is not where you want to be if you want a fulfilling sex life, which stands to reason when frequency is a significant factor in satisfaction. The real issue is the move from a lack of desire to active displeasure in the act, dis-pleasure in the literal sense of the word, and physical pain is a key part of it. Pain kills sex.
B1“Please share with me what it is about sex that makes you feel this way?” EVE’s opening question, then two to five follow-ups, coded against 28 themes
A2“…move the slider to the image that best expresses how you feel about having sex.” 0 extremely negative to 100 extremely positive
B1“Please share with me what it is about sex that makes you feel this way?” EVE’s opening question, then two to five follow-ups, coded against 28 themes
A2“…move the slider to the image that best expresses how you feel about having sex.” 0 extremely negative to 100 extremely positive
Who says what. Seven in ten of those who raised low desire were women, and they were older than average. Losing a partner came almost entirely from older single women, health and pain mostly from people over 55, and eight in ten of the few who said they dislike the act were women. Drivers of sexual satisfaction lean in the opposite direction. Pleasure is talked about more by men, and closeness most by younger people in a couple. The themes are not just moods. They map onto lives.
Kink
Some of the more ‘interesting’ things people said. Nobody asked about kink directly. These came up unprompted, mostly when EVE asked what people would try if they experimented and which sex toys they use.
Anal and butt play
Top of the chart. Bottoms too.
Most likelyMostly men, often 25 to 34 · satisfaction 84
Bondage, whips and who is in charge
Tied for second place.
Most likelyMen and women alike, often 25 to 34 · satisfaction 89
Role play and dressing up
Someone else entirely, for an evening.
Most likelyMostly men, often 45 to 54 · satisfaction 84
Threesomes, group sex and swapping
Far more wished for than done.
Most likelyMostly men, often 35 to 44 · satisfaction 79
Watching and being watched
An audience of one, usually.
Who said it5 people, 3 of them men · satisfaction 88
Dolls and machines
Some assembly required.
Who said it4 people, 3 of them men · satisfaction 89
Fetishes
Wet denim and high heels. No judgement.
Who said it3 people, 3 of them men · satisfaction 83
Raiding the kitchen
Cold carrots, a drinking glass, a brush.
Who said it2 people, 0 of them men · satisfaction 80
“I wear a strap-on and have sex with a female sex doll whilst my husband watches and masturbates.”Woman, 55 to 64 · satisfaction 98 · from the sex toys chat
“A whip to whip a fuck boy or be whipped myself.”Woman, 45 to 54 · satisfaction 96 · from the sex toys chat
“I enjoy the sexual and body feelings of wearing wet jeans, which is my fetish.”Man, 75+ · satisfaction 72
“When I was younger I was quite adventurous, including same sex, threesomes and group sex. I'm not into it anymore though. It's definitely worth trying once, but it gets a bit draining.”Woman, 45 to 54 · satisfaction 64
“Strap-on dildo. This is for my husband because I want to peg him. This gives me an extreme amount of pleasure but he isn’t into it.”Woman, 25 to 34 · satisfaction 82 · from the sex toys chat
“Bondage is exciting with someone you can trust.”Woman, 25 to 34 · satisfaction 87
“Would like to have a threesome with two men, maybe even film it, try bondage as long as partners promise to untie me.”Woman, 55 to 64 · satisfaction 98
“He’s pink, shaped like a penis, has a pet rabbit and vibrates. His name is Bob.”Woman, 55 to 64 · satisfaction 27 · from the sex toys chat
Overheard
“It helps me feel 'wanted' and connected with my husband, especially now we've had a baby. It's nice to feel like myself again and not just a mum.”Woman, 25 to 34 · satisfaction 65

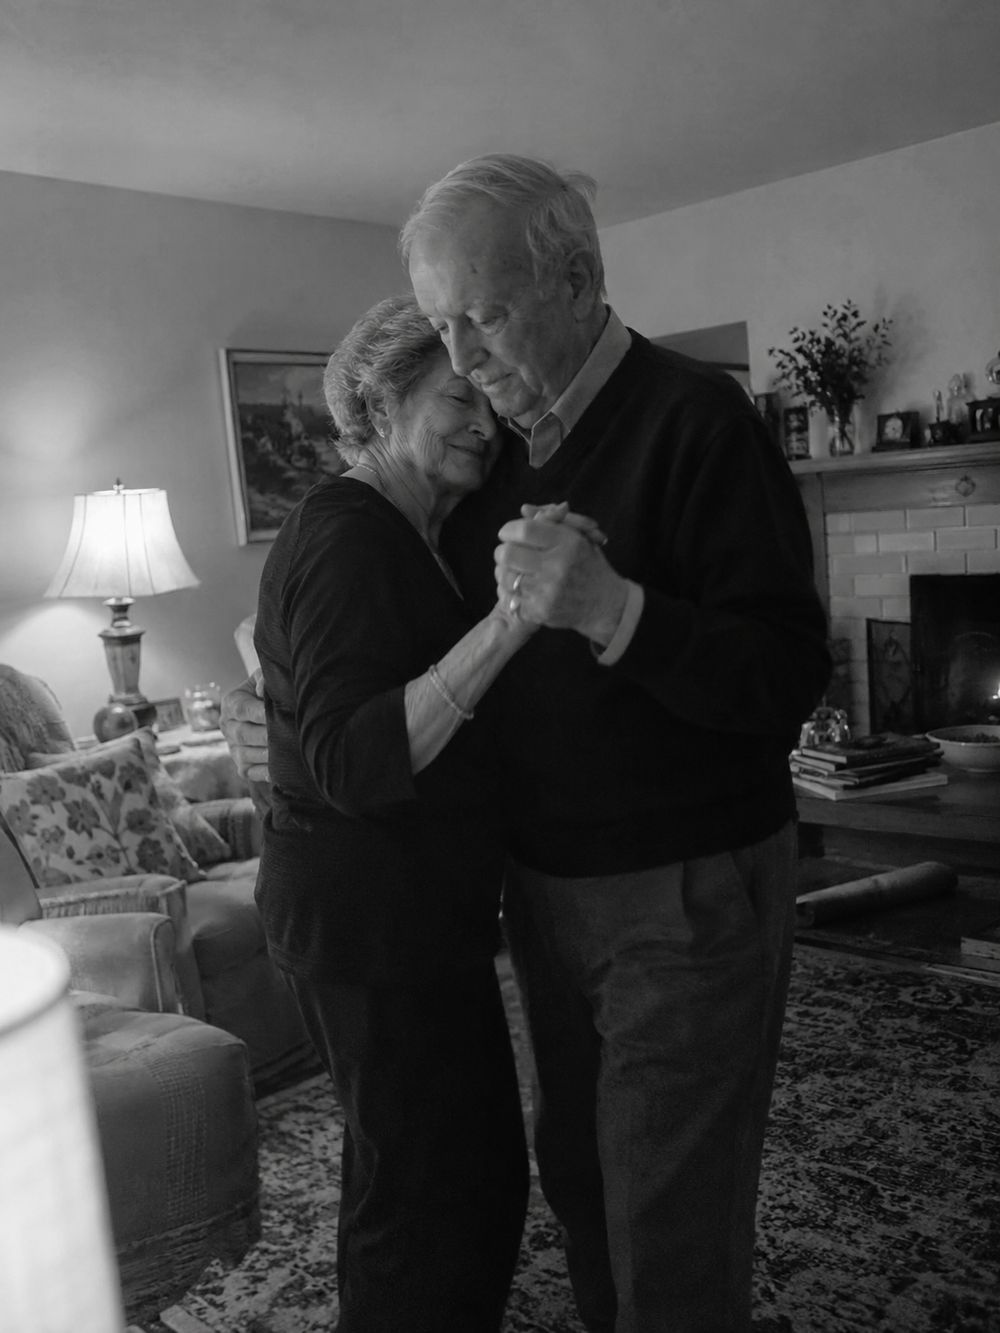
III
Why women’s satisfaction falls faster
A2“…move the slider to the image that best expresses how you feel about having sex.” 0 extremely negative to 100 extremely positive
bySplit by age and gender (S1, S2)
Under thirty-five, men and women feel almost exactly the same about sex. From thirty-five the lines part. Women’s scores fall with each decade while men’s hold, until by seventy-five and over the gap is seventeen points.
Put a number on it and each extra decade of age widens the gap by 2.5 points. At 35 to 54, women are almost three times as likely as men to rate sex at 40 or lower. By seventy-five and over, four in ten women do, against about a quarter of men.
The obvious explanations are bodily: menopause, hormones, pain. They appear in the conversations. But the survey points somewhere more ordinary first, to the simple question of who still has someone to have sex with.
A1“Our first question is to understand the range of sexual activities that you partake in. Which of the following applies to you?” Tick all that apply
D3“How often do you typically have sex with another person, excluding masturbation?” Asked of anyone who ticked a partnered activity in A1
bySplit by age and gender (S1, S2)
Case notes
Why do men claim more sex than women their age?
If most sex is between a man and a woman, the two lines should roughly cancel out. Across all ages they do, with men and women almost level. Within each age group they don’t. Five clues explain it.
It depends how you count
A looser count added 10% of men and 6% of women who have sex with a partner less than monthly. The chart above leaves them out.
Ask only the direct question, sexually active in the last three months, and the middle years match.
Direct question only: sexually active in the last 3 months, by age
% who said they were sexually active in the last three months
Men pair with younger women
76% of women under 35 are in a couple, against 53% of men.
Young women partner older men, so young women lead and men catch up later.
Women outlive their partners
At 75 and over, 73% of men are still in a couple and only 42% of women.
“I am a widow so sex isn't on my agenda, no matter how much I miss it.”Woman, 75+ · satisfaction 13
Single men find sex elsewhere
29% of single men aged 55 to 74 have partnered sex, against 10% of single women.
Men are three times as likely to have casual sex.
“I don't have a sexual partner or girlfriend, so sex is via a working girl or prostitute.”Man, 65 to 74 · satisfaction 93
A little bravado?
Married men and women give the same typical frequency, about weekly under 55.
The difference is at the top end. Married men under 35 average 8.6 times a month, married women 6.2.
Verdict
Mostly solved. Part of the gap was how partnered sex was counted, part is who pairs with whom and part is widowhood. What is left is real: older single men find sex, often casual or paid for, that older single women do not.
A2“…move the slider to the image that best expresses how you feel about having sex.” 0 extremely negative to 100 extremely positive
bySplit by age and gender (S1, S2)
Put simply, having a sex life with a partner is the biggest single difference between feeling good and feeling bad about sex, at any age, and women lose it sooner. With age and gender alone, women fall 2.5 points in satisfaction further behind men with each decade. Add two facts to the model, whether someone has partnered sex and whether they are single, and the extra loss more than halves, to 1.1 points, which is no longer statistically distinguishable from zero. Having partnered sex is worth 20 satisfaction points on its own.
Among people who are still having sex, women sit four to nine points below men, and that gap barely moves with age, while across everyone it grows from 1 point under 35 to 17 at seventy-five and over. What grows is the number of women who are no longer in that group.
One difference holds at every age: women feel less positive about their energy for sex, shown below. Confidence follows the same pattern.
A3“Below are some factors related to sex. Please use the scale to indicate your feelings about each of them.” Very positive to very negative
bySplit by age and gender (S1, S2)
B1“Please share with me what it is about sex that makes you feel this way?” EVE’s opening question, then two to five follow-ups, coded against 28 themes
bySplit by age and gender (S1, S2)
Men and women talk about sex differently. Men lead with physical pleasure, stress relief, giving pleasure and wanting more. Women lead with intimacy, trust, feeling wanted and the relationship, and they carry most of the barriers: low desire, tiredness and sex as a chore.
Women also simply said more. They wrote about a fifth more than men and raised more themes, and the extra was not padding. Women were four times as likely to talk about trust and three times as likely to talk about feeling wanted. For many women good sex depends on conditions being right first: feeling safe, feeling desired, knowing the other person. Men more often describe sex as good in itself, a pleasure, a release, a need.
The barriers are where the difference bites. Women were more than twice as likely to raise low desire and three times as likely to mention tiredness and busy lives. Of the 22 people who described sex as a chore, 20 were women. Those themes are among the heaviest drags in the driver model, which is why a man and a woman of the same age can feel so differently about what may be the same sex life. It is not that women want less from sex. They are carrying more of what gets in its way.
Run the driver model separately for each group and the differences sharpen. For younger women the barriers are about load: tiredness, busy lives and sex as a chore, put down to work, children and a partner who wants more. For older women they are about absence: low desire, no partner and loss. Older men keep talking about pleasure, and health enters their list.
Women 18 to 54
n=305 · themes explain 54%
- 20%Low desire
- 15%Dislike of the act
- 8%Health, pain and physical limits
Men 18 to 54
n=255 · themes explain 29%
- 42%Low desire
- 17%Physical pleasure
- 14%Intimacy and closeness
Women 55 and over
n=170 · themes explain 57%
- 13%Intimacy and closeness
- 12%Physical pleasure
- 10%Loss of a partner
Men 55 and over
n=196 · themes explain 52%
- 22%Low desire
- 18%Sexual dysfunction
- 14%Health, pain and physical limits
Read the four panels as four different conversations. Under 55, a man’s satisfaction turns almost entirely on desire: low desire alone carries about two fifths of what the model explains for younger men. For younger women it is spread across desire, a dislike of the act and their health, and the themes explain far more of their score.
After 55 the picture splits again. For women the biggest lifts are intimacy and physical pleasure and the heaviest drag is losing a partner. For men it is mechanics: desire, sexual dysfunction and health. The quotes below come from each of the four groups.
“The way he makes me feel comfortable with my body without a sense of judgement nor self-consciousness.”Woman, 18 to 24 · satisfaction 100
“The whole thing feels wonderful and the whole body release is fantastic. Great to destress.”Man, 35 to 44 · satisfaction 82
“I feel the need to feel wanted, especially as I am ageing, and need to know my husband still finds me attractive.”Woman, 55 to 64 · satisfaction 70
“I am 79 and after an operation for prostate cancer, radiotherapy and hormone injections I am over it.”Man, 75+ · satisfaction 33
In their own words · 1
Single, and satisfied or not
Single people are the least satisfied group, but a third of them still rate sex 81 or higher. What separates the content from the unhappy is what is still in their lives.
B1“Please share with me what it is about sex that makes you feel this way?” EVE’s opening question, then two to five follow-ups, coded against 28 themes
bySplit by satisfaction (A2)
The two groups barely overlap. Satisfied singles are younger and mostly men. About half of them still have sex with someone, casual or new. They talk about pleasure, closeness and relief, much as people in good relationships do: “sex is different if u have a real connection with someone and they feel the same way about you”
Unsatisfied singles are older and mostly women. Almost none of them have sex with anyone. Their conversations are about what has gone: desire, a partner, health. Many are widowed or divorced, and some have simply closed the door. “at my age companionship is far more important”
So being single is not the problem in itself. Connection is. Singles who still have someone to be close to feel much like couples; those without anyone carry the low scores, and it is the same absence that drives the gap between older women and men.
“Enjoyed it previously but have had no partner for some years now.”Woman, 75+ · satisfaction 22
In their own words · 2
Why mid-life women are less satisfied
At 35 to 54, women are almost three times as likely as men to be unsatisfied. Most still have a partner. Their conversations point to desire, load and the body.
B1“Please share with me what it is about sex that makes you feel this way?” EVE’s opening question, then two to five follow-ups, coded against 28 themes
bySplit by satisfaction (A2)
Partners explain only a sliver of the mid-life gap. With age group and gender alone, women aged 35 to 54 sit about eleven points below men. Allow for whether they have partnered sex and whether they are single and the gap is still about nine. Add the barriers they talk about, low desire, tiredness, health, body image, sex as a chore and mismatched desire, and it falls to about three, too small to be sure of.
So the story changes with age. In mid-life, women’s lower satisfaction is mostly about what gets in the way of sex with the partner they have: “After work family cooking cleaning I'm just too tired” After 65 it is mostly about not having a partner at all.
“the act of sex almost feels like a chore at times to get over and done with”Woman, 35 to 44 · satisfaction 24
“I feel I am not fulfilling my obligations as a wife, I cannot pleasure him and we are no longer intimate due to pain issues”Woman, 45 to 54 · satisfaction 11
The secret life of sex toys
We asked almost everyone, 888 of the 926, what toys they use and why. Here is what they told EVE about the drawer by the bed.

The toy-box paradox
Women are more likely than men to own a sex toy, and under 55 they are about twice as likely. Yet women rate sex lower than men at almost every age. The two facts fit once you split women by the drawer. Women who use toys rate sex at 80, close to men who use them at 84. Women who don’t sit at 62, 12 points below men who don’t.
The toy owners are not, on the whole, women who have given up on their partners. Women with a sexual partner are three times as likely to use a toy, and in couples the owners have just as much sex with their partner, about weekly. They are younger, a median age of 38 against 50, far more likely to orgasm during sex and far less likely to raise low desire. The toy sits beside a sex life that is working, and it fades with it, from about a third of women under 35 to almost none at 75 and over.
There is something in the idea that a toy stands in for effort, though. In couples, women who own one talk about using it alone more often than with their partner. For men it is the other way round. Ask why and the answer is speed and certainty: it is ‘quick and efficient’, it works when a partner ‘can't get me off’, and it is there when the kids are at school and nobody has the energy for more. The gap in women’s satisfaction is not in the toy drawer. It sits with the older, partnerless and low-desire women who were never in it.
A1“Our first question is to understand the range of sexual activities that you partake in. Which of the following applies to you?” Tick all that apply
bySplit by age and gender (S1, S2)
“If I want to get off then my sex toys do it for me straight away and I don't need to get tired.”Woman, 35 to 44 · satisfaction 76 · from the sex toys chat
“I don't use sex toys as my penis is the one toy I prefer.”Man, 65 to 74 · satisfaction 96 · from the sex toys chat
B4“What types of sex toys do you ever use and what’s the reason for using or not using them?” EVE’s sex toys chat, then two to four follow-ups
B4“What types of sex toys do you ever use and what’s the reason for using or not using them?” EVE’s sex toys chat, then two to four follow-ups
Buzz or thrust
“In summing up, it’s the Constitution, it’s Mabo, it’s justice, it’s law, it’s the vibe and… no, that’s it, it’s the vibe. I rest my case.”
Dennis Denuto, The Castle
The two most named toys tell different stories. The vibrator belongs to women: seven in ten people who named only a vibrator were women, and they talk about the clitoris and about orgasm, often in the same breath, and about speed. “Feeling a vibrator on your clit is so stimulating and gives me such intense orgasms.” The dildo is split evenly between the sexes, and the men who mention one mostly mean using it on someone else: 14 of the 35, to make things ‘a bit different’, for ‘her pleasure’ or, more candidly, ‘if I am having difficulty performing’.
“It is like a good cock, but in plastic.”Woman, 45 to 54 · satisfaction 97 · from the sex toys chat
The dildo is also the toy people hold up against the real thing. Those who named only a dildo were about twice as likely as vibrator owners to compare it with a penis, and it usually loses: rubbery, cold, ‘can't compare with penis’. A vibrator doesn’t compete with a partner. It does something a partner often can’t. As one woman in her early fifties put it, “A vibrator because it's more satisfying than my partner” That may be why it is the toy women keep in the drawer, and the dildo the one couples bring out now and then.
Split men and women by whether they use toys and most of the gender gap closes: 4 points between toy users, 12 between everyone else.
A quarter said lingerie makes them feel sexy. Cost came up three times as often as turning a partner on, and almost every complaint about comfort and fit came from women.
The desire gap
Two people, one bed, different appetites
About one couple in nine told EVE that one of them wants sex more often than the other. It is a quiet crisis inside otherwise good relationships.
B1“Please share with me what it is about sex that makes you feel this way?” EVE’s opening question, then two to five follow-ups, coded against 28 themes
bySplit by satisfaction (A2)
A small group with a big problem. Couples with a desire gap rate sex about seven points lower than other couples, they are twice as likely to be unsatisfied, and only one in six feels good about how often they have sex.
Men and women both feel it. Men were more likely to say they want more sex, women more likely to describe the mismatch itself, and some of the most frustrated voices came from women whose partners had lost interest. On one side of the bed sits guilt, on the other rejection, and between them silence: only a third are comfortable talking about sex, against six in ten other couples.
This is where the stuck couples type lives. Four in ten of these couples fall into it, and a third are bonded partners holding the line. Left unspoken, the gap turns sex into a negotiation.
The one who wants less
“My husband would like more often though I don't care as much.”Woman, 35 to 44 · satisfaction 72
“I am unhappy and failing in my relationship because I feel there is a pressure to have regular sex which I don't enjoy”Woman, 35 to 44 · satisfaction 33
The one who wants more
“Frustrated, as my husband and I don’t have sex at all.”Woman, 55 to 64 · satisfaction 94
“High sex drive and sometimes feel like I am pushing my partner”Woman, 45 to 54 · satisfaction 84
Overheard
“Frustrated, and feelings of loneliness: one starts to feel neglected in the marriage and, though not actively looking, this can lead to having affairs.”Woman, 65 to 74 · satisfaction 86

IV
Seven sexual types
Field guide
The seven at a glance
| Type | Share | Satisfaction | Age | Women | In a couple | Partnered sex | Most distinctive theme |
|---|---|---|---|---|---|---|---|
| Generous lovers | 9% | 87 | 52 | 35% | 74% | 67% | Giving pleasure |
| Bonded partners | 22% | 83 | 49 | 61% | 90% | 79% | Feeling wanted and desired |
| Release seekers | 37% | 80 | 46 | 38% | 56% | 60% | Stress relief and wellbeing |
| Open communicators | 6% | 80 | 36 | 66% | 80% | 73% | Trust and safety |
| Stuck couples | 6% | 46 | 46 | 70% | 89% | 57% | Sex as a chore |
| The partnerless | 7% | 43 | 62 | 70% | 4% | 3% | No partner |
| Body says no | 12% | 36 | 58 | 59% | 62% | 18% | Health, pain and physical limits |
| All 926 | 100% | 71 | 49 | 51% | 66% | 56% |
How to read the field guide
Each type gets a page. At the top are its size and the numbers that define it: average sexual satisfaction on the 0 to 100 scale, the share who rate 81 or higher and 40 or lower, the share who are women and the average age. Every figure is set against all 926 people so you can see what is unusual.
What they talk about shows the themes this type raised most often when EVE asked what it is about sex that makes them feel the way they do. Nobody ticked these. We read every conversation in 2026 and coded it against 28 themes, so the percentages are the share whose own words touched on each one. The types were built from these themes, so they differ most here.
How they feel uses the five closed ratings: energy, confidence, talking about sex, fulfilment and frequency. Energy and confidence are the two that track satisfaction most closely. The row of facts below covers their lives and what they do, with arrows where they sit well above or below everyone else. Each page opens with a persona, a composite character built from the type’s numbers. The personas are invented; the four quotes that end each page are real.
If sexual satisfaction is one way to sort people, what they talk about is another. We ran a latent class model on the 28 coded themes, a method that groups people whose conversations look alike, and seven types emerged. Four are largely satisfied. Three are not, and each of the three has a different problem.
Researchers like putting people in boxes, and in this case our boxing is pretty solid, with certainty of allocation of 79 to 90 per cent depending on the type. But plenty of people display traits of more than one segment. Also, for LOLZ (or perhaps personal discovery), we’ve built a magazine builder. Type in any topic, from fellatio to menopause, and it makes you a page like this one from what people told EVE. Searches are anonymous and every page it builds is shared with the next person who asks.
B1“Please share with me what it is about sex that makes you feel this way?” EVE’s opening question, then two to five follow-ups, coded against 28 themes
A2“…move the slider to the image that best expresses how you feel about having sex.” 0 extremely negative to 100 extremely positive
B1“Please share with me what it is about sex that makes you feel this way?” EVE’s opening question, then two to five follow-ups, coded against 28 themes
A2“…move the slider to the image that best expresses how you feel about having sex.” 0 extremely negative to 100 extremely positive
In short, a person’s type tells you a lot about how they feel about sex, but not everything. No generous lover or bonded partner rated sex at 40 or lower, and most generous lovers rated it 81 or higher. At the other end, more than half of the type we call body says no rated it 40 or lower, as did close to half of stuck couples and four in ten of the partnerless.
Each type has a signature. Generous lovers all talk about pleasure and most about giving it. Bonded partners talk about intimacy and their relationship; open communicators about knowing each other and trust. The unsatisfied types split cleanly. Stuck couples talk about mismatched desire and sex as a chore, the partnerless about having no partner and losing one, and body says no about low desire and health.
Men are a little more likely to be single, yet the partnerless are mostly women. The partnerless are mostly older people who have lost a partner; most single men are younger release seekers.
S1“Please enter your age in the box below.”
S2“Do you identify as…” Man, woman, non-binary or a different identity
B1“Please share with me what it is about sex that makes you feel this way?” EVE’s opening question, then two to five follow-ups, coded against 28 themes
A3“Below are some factors related to sex. Please use the scale to indicate your feelings about each of them.” Very positive to very negative
A2“…move the slider to the image that best expresses how you feel about having sex.” 0 extremely negative to 100 extremely positive
Of the five feelings we asked about, energy for sex and sexual confidence are the two that track satisfaction most closely. Line the seven types up on them and they do not spread out evenly. They fall into two camps with a gap in the middle. In the four satisfied types, well over half feel positive about their energy and confidence. In the three unsatisfied types, one in five or fewer do. No type sits in between.
That is the clearest single test of which camp someone is in: ask how they feel about their energy and their confidence. The table below shows the other three feelings too. Generous lovers, the most satisfied type of all, are among the least happy with how often they have sex. Frequency is the weakest of the five. It is not how often people have sex that separates the satisfied from the rest. It is whether they have the energy and the confidence to enjoy it.
Overheard
“The more I do it the more confidence I have, and the better the sex the better I feel afterwards.”Man, 35 to 44 · satisfaction 100

Type 1 of 7 · 9% of people · 86 people
Generous lovers
Pleasure is the point, and giving it matters as much as getting it.
Meet Gary, 52, the happiest lover in the study. For Gary the best bit is watching his partner enjoy it, and like most of his type he talks about giving pleasure as much as getting it. He flirts with the barista, watches a bit of porn and almost always finishes; generous lovers are more likely to orgasm during sex than any other type. His one gripe is frequency. He would go again tomorrow, and only about a third of his type are happy with how often they get to.
all 926: 71
all: 44%
all: 15%
all: 51%
all: 49
What they talk about
% of this type whose conversation with EVE raised each theme. Coded in 2026 from what they typed, not from a list they ticked. The tick marks all 926.
How they feel about their sex life
% very or somewhat positive about each (A3). The tick marks all 926. Energy and confidence matter most for satisfaction.
Who they are
Each line shows how much more or less common a group is in this type than among all 926, from a quarter as common to four times. Right: % of this type v % of everyone.
What they do
% who tick each in A1, or have partnered sex at least monthly and weekly (D3). The tick marks all 926.
“I just like foreplay and love watching my wife have an orgasm.”Man, 55 to 64 · satisfaction 99
“I think it's fulfilling when we both get pleasure and satisfaction and are both making each other happy.”Woman, 35 to 44 · satisfaction 94
“Giving someone pleasure makes me feel good about myself.”Man, 45 to 54 · satisfaction 100
“I love the feeling of skin-to-skin contact and the endorphins it gives me.”Woman, 55 to 64 · satisfaction 99

Type 2 of 7 · 22% of people · 206 people
Bonded partners
Sex is how a long relationship stays close and how they feel loved and wanted.
Meet Sharon, 49, married to Dave for twenty-two years, with two teenagers down the hall. Sex is the one part of the week that is just theirs, where she feels like a wife again rather than the family taxi. She talks about closeness, the relationship and feeling wanted, and she is content: bonded partners are the most likely of any type to feel fulfilled, and not one rates sex at 40 or lower. Ask her what makes it good and she will say Dave.
all 926: 71
all: 44%
all: 15%
all: 51%
all: 49
What they talk about
% of this type whose conversation with EVE raised each theme. Coded in 2026 from what they typed, not from a list they ticked. The tick marks all 926.
How they feel about their sex life
% very or somewhat positive about each (A3). The tick marks all 926. Energy and confidence matter most for satisfaction.
Who they are
Each line shows how much more or less common a group is in this type than among all 926, from a quarter as common to four times. Right: % of this type v % of everyone.
What they do
% who tick each in A1, or have partnered sex at least monthly and weekly (D3). The tick marks all 926.
“I love the feeling of getting to be “us” as a couple instead of just exhausted parents.”Woman, 25 to 34 · satisfaction 79
“It helps to bond the two of us together & reaffirm our commitment to each other.”Man, 75+ · satisfaction 78
“The two are intertwined. Sex without love is just sex.”Man, 55 to 64 · satisfaction 74
“I am accepted for my size and shape and it means my husband accepts this and still wants to have sex with me.”Woman, 55 to 64 · satisfaction 98

Type 3 of 7 · 37% of people · 339 people
Release seekers
Sex is a physical good: pleasure, stress relief and a natural need.
Meet Jason, 46, part of the biggest crowd in the country. Sex is how Jason clears his head, like a surf or a beer after work, only better. He likes a bit of attention, is happy partnered or single, and is more likely than anyone to have had casual sex. Ask him why he likes it and you will get a line or two: feels good, takes the edge off. Release seekers typed fewer words to EVE than almost any other type, and most of them rate sex highly.
all 926: 71
all: 44%
all: 15%
all: 51%
all: 49
What they talk about
% of this type whose conversation with EVE raised each theme. Coded in 2026 from what they typed, not from a list they ticked. The tick marks all 926.
How they feel about their sex life
% very or somewhat positive about each (A3). The tick marks all 926. Energy and confidence matter most for satisfaction.
Who they are
Each line shows how much more or less common a group is in this type than among all 926, from a quarter as common to four times. Right: % of this type v % of everyone.
What they do
% who tick each in A1, or have partnered sex at least monthly and weekly (D3). The tick marks all 926.
“It is always a relief for me to have sex. I need it to clear my mind so I can get on with the day.”Man, 65 to 74 · satisfaction 100
“You relax when you have sex. It takes the stresses of life away.”Woman, 25 to 34 · satisfaction 99
“Makes me feel alive, and in that moment I can forget all the crap in my life.”Woman, 55 to 64 · satisfaction 78
“Feel good not just at the time but for the next day.”Woman, 55 to 64 · satisfaction 76

Type 4 of 7 · 6% of people · 56 people
Open communicators
Good sex comes from talking, trust and knowing what each other likes.
Meet Priya, 34. Priya and her partner talk about sex the way other couples talk about holiday plans: what worked, what they would like to try and what is off the table. Trust comes first, then curiosity. She typed more to EVE than nearly anyone, she is among the youngest in the study, and more than half of her type have sex weekly or more.
all 926: 71
all: 44%
all: 15%
all: 51%
all: 49
What they talk about
% of this type whose conversation with EVE raised each theme. Coded in 2026 from what they typed, not from a list they ticked. The tick marks all 926.
How they feel about their sex life
% very or somewhat positive about each (A3). The tick marks all 926. Energy and confidence matter most for satisfaction.
Who they are
Each line shows how much more or less common a group is in this type than among all 926, from a quarter as common to four times. Right: % of this type v % of everyone.
What they do
% who tick each in A1, or have partnered sex at least monthly and weekly (D3). The tick marks all 926.
“The ability to share thoughts and feelings without being afraid of feeling judged or hurting the other person is vital.”Woman, 18 to 24 · satisfaction 100
“Overall I am satisfied with my current sex life and look to improve our shared experiences by slowly building comfort with sexual experimentation and learning!”Man, 25 to 34 · satisfaction 73
“It’s fun talking to your partner about what they like and what you like, and trying it to see if you prefer it as well, to spice it up a bit.”Woman, 18 to 24 · satisfaction 96
“We know what each other wants and likes to do, and we are also comfortable with our bodies and imperfections.”Woman, 25 to 34 · satisfaction 91

Type 5 of 7 · 6% of people · 56 people
Stuck couples
Partnered, but desire has drifted apart and sex has become another job.
Meet Michelle, 46, with two kids, a full-time job and a husband who wants it more than she does. Most nights she would rather sleep. When they do have sex it feels like one more job on the list, and she knows he takes the knock-backs personally. Nobody here is a villain. Half of stuck couples raise low desire, almost half a mismatch, and only one in eight feels good about how often they have sex.
all 926: 71
all: 44%
all: 15%
all: 51%
all: 49
What they talk about
% of this type whose conversation with EVE raised each theme. Coded in 2026 from what they typed, not from a list they ticked. The tick marks all 926.
How they feel about their sex life
% very or somewhat positive about each (A3). The tick marks all 926. Energy and confidence matter most for satisfaction.
Who they are
Each line shows how much more or less common a group is in this type than among all 926, from a quarter as common to four times. Right: % of this type v % of everyone.
What they do
% who tick each in A1, or have partnered sex at least monthly and weekly (D3). The tick marks all 926.
“My partner doesn't spend time with me and the only time he shows me any attention is when he wants sex.”Woman, 25 to 34 · satisfaction 60
“The sex I have is the same every time. It’s never random, it’s always boring.”Woman, 25 to 34 · satisfaction 42
“I don't dislike it but I don't enjoy it. It's more like a chore.”Woman, 18 to 24 · satisfaction 52
“The thought of enjoyable sex makes me feel excited, but it's been a few years since I felt like that. Now I feel very indifferent.”Woman, 25 to 34 · satisfaction 35

Type 6 of 7 · 7% of people · 69 people
The partnerless
Sex ended with a partner who died or left, and no one has taken their place.
Meet Joan, 68. Joan was married for forty years, and since Ron died there has been no one. Some days she misses it badly; on others she is perfectly happy with her own company and a good book. She is typical of the partnerless: almost all single, mostly women and mostly over 65, and almost none have sex with anyone. For most of them sex ended along with the relationship.
all 926: 71
all: 44%
all: 15%
all: 51%
all: 49
What they talk about
% of this type whose conversation with EVE raised each theme. Coded in 2026 from what they typed, not from a list they ticked. The tick marks all 926.
How they feel about their sex life
% very or somewhat positive about each (A3). The tick marks all 926. Energy and confidence matter most for satisfaction.
Who they are
Each line shows how much more or less common a group is in this type than among all 926, from a quarter as common to four times. Right: % of this type v % of everyone.
What they do
% who tick each in A1, or have partnered sex at least monthly and weekly (D3). The tick marks all 926.
“I enjoyed sex when my wife was alive. No opportunity now.”Man, 65 to 74 · satisfaction 64
“I choose not to have sex as I'm divorced and choose not to get another partner. I am perfectly comfortable with my own company.”Woman, 65 to 74 · satisfaction 50
“The longer you don't have it, the more walls you put up and the scarier it is.”Woman, 35 to 44 · satisfaction 30
“I'm a widow and over the sex thing. Enjoyed it in my marriage.”Woman, 75+ · satisfaction 50

Type 7 of 7 · 12% of people · 114 people
Body says no
Desire has gone, held back by health, pain, ageing or a body that no longer cooperates.
Meet Lorraine, 61. Lorraine’s back is bad, menopause took most of her desire with it and sex now tends to hurt. Her husband is patient, which somehow makes her feel worse. She has not had sex in over a year and would not call herself a flirt any more. Body says no is the least satisfied type: half raise low desire, almost four in ten health or pain, and only one in ten feels good about their energy for sex.
all 926: 71
all: 44%
all: 15%
all: 51%
all: 49
What they talk about
% of this type whose conversation with EVE raised each theme. Coded in 2026 from what they typed, not from a list they ticked. The tick marks all 926.
How they feel about their sex life
% very or somewhat positive about each (A3). The tick marks all 926. Energy and confidence matter most for satisfaction.
Who they are
Each line shows how much more or less common a group is in this type than among all 926, from a quarter as common to four times. Right: % of this type v % of everyone.
What they do
% who tick each in A1, or have partnered sex at least monthly and weekly (D3). The tick marks all 926.
“For the past few years I have been enjoying sex less due to the fact that my vagina has become very dry and penetration tends to be painful.”Woman, 65 to 74 · satisfaction 50
“I just am not physically attracted to my partner and I think this is the reason why the sex life suffers.”Woman, 25 to 34 · satisfaction 0
“Endometriosis: very painful. Chronic fatigue syndrome: no energy.”Woman, 25 to 34 · satisfaction 16
“When you get to my age you don't want or even think about sex.”Man, 75+ · satisfaction 0
V. What makes a happy sex life
Put the pieces together and a happy sex life, in this study, has three things in it: energy, confidence and pleasure. Energy and confidence predict satisfaction far better than how often people have sex. Pleasure is the biggest lift in what people say, and low desire the biggest drag.
The span of satisfaction is mostly a story about presence. At the bottom of the scale people describe something that has stopped: desire, health, a partner. In the middle it is fading. Higher up it is shared, and at the top it is enjoyed.
Age is harder on women’s sex lives, but mostly through who is still in them. Women lose partnered sex sooner, through widowhood, a partner’s health and being single, and once that is accounted for most of the widening gap between men and women goes.
The unsatisfied are not one group. Stuck couples need help inside a relationship. The partnerless are living without one. Body says no is held back by health and desire. A campaign, a clinic or a product that treats them as one audience will miss two of the three.
“The ability to give yourself to your partner and know that it is the one time you can be fully comfortable with your partner.”Woman, 25 to 34 · satisfaction 81
None of this would be visible in a single score alone. It came from 926 people who were asked why by EVE, and who answered.
“It makes me feel empowered, attractive and happy.”Woman, 35 to 44 · satisfaction 87
Overheard
“Used to feel very fulfilled, but since my husband died it is now just a response to a physical need.”Woman, 75+ · satisfaction 60

Part Two
EVE then and now
The power of asking why
Everything in Part One grew from two questions: how does sex make you feel, and why. In 2021 a rules engine asked them. The same power is far greater today.
The extraordinary thing about EVE is that a few simple questions can yield an extensive and deep exploration of a topic like sexual attitudes. The secret sauce is the answers: 48,857 words of lived experience from 926 Australians who felt safe to share something about themselves with us.
Even in retrospect, five years later, the level of detail and self exposure is extraordinary. The analysis uses the quant questions to ground the investigation, but it is the qual AI that really goes beyond what traditional research has been able to uncover. So whilst this report is about a very personal topic, you can easily envisage the power of qual AI with EVE to delve into the world of snack food, software, data, travel, superannuation and many other categories to similar levels of insight.
That is the power of qualitative AI. It puts a curious interviewer in front of every respondent, at the scale and cost of a survey, and it gets people talking about things they would never say to someone with a clipboard. People knew they were talking to a bot. Many said more because of it.
The EVE that ran this study was primitive by today’s standards. It worked from about 130 pages of hand-written grammar rules that spotted key words and triggered scripted follow-ups. It misheard, echoed stray words and now and then claimed people had said things they hadn’t. Even so, it drew out enough to fill this book. Part Two looks at how it worked, where it stumbled and what the same two questions can yield now that every probe is written by AI and the analysis runs inside the platform.
“My body image issues and self-consciousness about my weight impact on my willingness to initiate intimacy.”Woman, 45 to 54 · satisfaction 66
How the survey flowed
Nine screens and about eight minutes, with a conversation in the middle. Everyone took the same path apart from two routed questions and the topic chats.
- IntroWelcome and disclosure
Told the questions were about sex, that answers were anonymous, to find a private place and that they would chat with a bot.
- S1–S3Screener
Age, gender and where you live, with quotas on all three.
Under 18 or quota full: thanked and closed
- A1What you do
Fourteen sexual activities, tick all that apply.
- A3How you feel about it
Frequency, fulfilment, comfort talking about sex, energy and confidence, very positive to very negative.
- A2Sexual satisfaction
One slider from 0 to 100, recoded into a word for EVE to play back.
- B1The EVE conversation1OpenerPlays back the score as a word, asks why2Follow-ups2 to 5, built from the last answer3PromptIntroduces a topic from a bank of 244Anything else?A last chance to add more
3 to 7 turns each, 4.5 on average · 3,198 follow-up questions in all
- B2–B4Topic chatsB2 Fulfilment 18B3 Casual sex 19B4 Sex toys 888
Sex toys was the main topic chat, asked of almost everyone. Small random samples also had a short chat on fulfilment or casual sex.
- D1–D5About you
Relationship, orientation, kids at home, sex frequency if A1 showed partnered sex, masturbation frequency if ticked in A1, and twelve statements about yourself.
- EndComplete
Median 7.8 minutes. 926 completes, 3 to 20 August 2021.
Every question EVE could ask
The opener
“You said that having sex makes you feel positive. Please share with me what it is about sex that makes you feel this way? Please remember, I am not a real person, I am a bot, I have no emotions, I don’t judge and my role is to help you think about your experiences and feelings.”
The word came from the slider: extremely negative (0 to 20), negative, neutral, positive or extremely positive (81 to 100).
Follow-ups
“You mentioned a lack of interest, please tell me more about this.”
“Could you go into more detail about your thoughts on the sex?”
“Please tell me a little more about how the thought of sex makes you feel.”
The first named a theme the rules recognised. The second echoed a single word back, which is where most misfires came from.
Number of conversations
- How would you describe the type of lover you are?127
- What makes your sex life fulfilling or not fulfilling?90
- What role does pornography play in your sex life?86
- If you were to experiment sexually, what would you like to do?80
- What are your thoughts on masturbation?78
- In your opinion, what makes a good sexual connection?78
- How do you feel about the amount of sex you have?71
- How do you feel about the emotional side of sex?61
- How do you feel about casual sex?60
- How important is it that you orgasm when having sex?53
- How do you feel about the importance of sex to relationships?40
B2 Fulfilment
“How would you describe how fulfilled you are with your current sex life and what makes it that way?”
B3 Casual sex
“I’d like to understand how you personally feel about casual sex, including how you would feel having a casual sex encounter.”
B4 Sex toys
“What types of sex toys do you ever use and what’s the reason for using or not using them?”
Woman, 45 to 54 · satisfaction 66. Notes in pink mark where the rules misfired.
She rated sex positively, yet her first answer goes straight to body image. The rules then named a theme she never raised, and she corrected them. A clumsy echo of a single word drew out her most revealing answer, about guilt. Four follow-ups, one wrong and one mechanical, still told us far more than her satisfaction score.
Thought experiment
The same interview, with EVE Qual Pro
An estimate, not a transcript. This is how EVE Qual Pro’s AI moderator would most likely have handled the woman in the replay, based on how it is designed to work. Only her first answer is real, so the rest of her answers are left out.
| EVE in 2021 asked | EVE Qual Pro would likely ask | |
|---|---|---|
| Introduction | “I am not a real person, I am a bot, I have no emotions, I don’t judge” | A named companion introduces the study in her own language, by text or voice, and tells her there are no right answers |
| Before the topic | Straight to the rating slider | Laddering, before sex is named: “When you think about closeness with a partner, what comes to mind first?” |
| Her first answer | “My body image issues and self-consciousness about my weight impact on my willingness to initiate intimacy.” | |
| First probe | “You mentioned feeling close and connected through sex”, a theme she never raised | “You said self-consciousness about your weight holds you back from initiating. What goes through your mind in those moments?” |
| Second probe | “How the willingness makes you feel”, an echo of one word | Reconciles her rating with her words: “You still rated sex as positive. What makes it good once you’re there?” |
| Third probe | “You mentioned being in a relationship”, a rule firing on a key word | Follows what she raises. If guilt about turning her partner down came up, as it did in 2021: “How do the two of you talk about it when you say no?” |
| Prompting | “Before we move on, how do you feel about casual sex?” | A briefed prompt on a study topic she hasn’t raised, such as what has ever helped her feel more confident in her body |
| Ending | The next survey question | The researcher’s closing question, then a thank you |
What Text Explorer actually made of her conversation
B1“Please share with me what it is about sex that makes you feel this way?” EVE’s opening question, then two to five follow-ups, coded against 28 themes
The follow-ups doubled what we learned. Each later reply was shorter than the first, but together they added up. Themes per person almost doubled between the opening answer and the end of the conversation, and most people raised something new after the opener.
The relational detail mostly surfaced late. Most mentions of knowing each other, of trust and of wanting more sex came in the follow-ups, not the opening answer. Without them, the open communicators and the stuck couples would have been much harder to see. And the follow-ups drew out the same share of words in every age band, from 18 year olds to 80 year olds.
B1“Please share with me what it is about sex that makes you feel this way?” EVE’s opening question, then two to five follow-ups, coded against 28 themes
We classified all 3,198 follow-up questions. The largest group built sensibly on what the person had said, and the next largest were prompts that introduced a new topic from a scripted bank. The rest show the limits of a rules engine. One in five were reflections that echoed a stray word back at the person, producing questions about “the years”, “the doors” and, from one typo, “the okder”. A small share were error probes, where EVE stuffed up and claimed the person had said something they hadn’t.
People noticed. More than a third of those error probes drew a correction, and the corrections were often blunt.
“Well no, I didn't mention that at all.”Woman, 25 to 34 · satisfaction 81
“No drugs involved, made a mistake typing.”Woman, 65 to 74 · satisfaction 76
“I have no interest in sex; this is not lack of enjoyment”Woman, 75+ · satisfaction 36
The misfires were the exception. Most people answered what they were asked, and at length. The sex toys chat that followed, asked of almost everyone, drew out some of the most candid answers in the study.
Then and now
How EVE listens now
The 2021 bot had one script and a rulebook. Today there are two ways to put EVE in front of people: EVE conversations inside a survey, and EVE Qual Pro, an AI moderator built on qualitative technique.
| EVE in 2021 | EVE today | EVE Qual Pro | |
|---|---|---|---|
| How a probe is written | Grammar rules spot a key word and fill a template | AI writes the probe from what the person said; model probes fire on keywords you choose | An AI moderator probes the topics the person raised, guided by your probe briefings |
| Shapes of conversation | One fixed script | AI Only, Guided AI and Model Only, plus Discussions that link several conversations | A full qualitative interview: introduction, laddering, probing, prompting and ending |
| Topics not yet raised | One switch from a bank of 24 scripted questions | Random prompts on topics in your model, capped by you | Prompting from briefings written so it never feels like an interrogation |
| What people say unprompted | Only the opening answer | The opening answer, before any topic is named | Laddering questions asked before the research topics are revealed |
| Researcher control | None once fielded | Caps on AI probes, model probes, prompts and total follow-ups | Probe and prompt briefings for each topic, plus the methodology you choose |
| Built for analysis | Nothing; coding was done afterwards | Models of topics, sub-topics and keywords, with every response coded against them | Reusable methodologies, from brand deprivation to keyhole projectives and empathy mapping |
| Stimulus and voice | Text only. “I am not a real person, I am a bot” | Text chat, previewed live before publishing | Image, video or audio stimulus, and a named moderator with avatar, language and voice |
| Where it runs | Inside this one survey | In Survey Shaper; one conversation can serve many surveys | In Survey Shaper or an external survey platform |
Each row answers a weakness in the 2021 audit. The rules engine stuffed up 3 per cent of its probes, spent 20 per cent on reflections that echoed stray words and 28 per cent on scripted prompts. Today the follow-up is written from the person’s own words, the researcher decides how far it digs, and the topics it brings in are the ones the study needs.
Then and now
From bag of words to Text Explorer
In 2021 the analysis could count words, score sentiment and summarise topics. Text Explorer now does the whole of Part One’s job, and more, inside the platform.
| What we could do in 2021 | Text Explorer today | |
|---|---|---|
| Words | A bag of words: which terms came up and how often | Top Terms, and Diff Terms for the words that set one group apart from another |
| Topics | One-line topic summaries | Topics and sub-topics classified automatically, ranked by mentions and by how positive or negative they are, with a deep dive into the comments behind each |
| Sentiment | Positive or negative, answer by answer | Positive, negative, neutral and mixed, plotted against how often each sub-topic comes up |
| Emotion | Not available | Emotional Insights on a Plutchik wheel, with a deep dive for each emotion |
| What drives the score | Not available | Text Drivers ranks the themes that predict an outcome such as satisfaction; an Impact Map and Co-Occurrence show how topics connect |
| Comparisons | By hand, in a spreadsheet | Comparison charts, data splits, time series and filters by any segment, with respondent labels beside every comment |
| Summaries | Written by an analyst | AI summaries of the whole dataset, or of any set of comments you select |
| Questions | Rerun the analysis | Ask EVE answers plain-language questions from the report and cites the comments it used |
| Quality | Not measured | A Text Quality Score and a Human Insights Factor for every project |
| Sharing | Spreadsheets | PowerPoint, Excel and JSON exports, live dashboards plus a secure read-only link that lets AI assistants such as Claude query the data directly |
That last row is how this edition was made. The 2021 responses were read through HumanListening’s connection for AI assistants, and every one of the 926 conversations was coded against 28 themes with AI, then checked. The driver model, the seven types, the kink count and the sealed section all came from that pass.

Two questions, more power than ever
Part One rests on a single slider and one open question. With a 2021 rules engine asking why, those two questions produced a satisfaction scale, a driver model that explains more than half of it, seven distinct sexual types and enough candour to fill a sealed section. Imagine the same two questions asked today.
An AI moderator would hear the woman in the replay talk about her weight and ask about that, instead of naming a theme she never raised. It would ladder before revealing the subject, so the first things people associate with sex arrive unprompted. It would prompt gently on the topics the study needs, and stop when the researcher says enough. And the analysis would be waiting when fieldwork closed: topics, sentiment, emotions, drivers and an assistant to question it.
The lesson of this study is that people will tell a machine the truth about the most private part of their lives if it asks well. In 2021 EVE asked clumsily and still heard plenty. Today it asks well.
| 2021 bag of words | 2025 Text Explorer | 2026 AI recode | |
|---|---|---|---|
| Produced | Word counts, sentiment and topic summaries | Sentiment, emotions and 39 auto-classified topics | 28 themes, probe audit, driver model, types and quotes |
| Themes per person | n/a | 1.85 | 2.87 |
| Unsatisfied with a barrier coded | n/a | 81% | 93% |
“We enjoy sex and talking to one another about it.”Man, 45 to 54 · satisfaction 86
Closing
What this study still teaches us
- A bot can open up a private subject at scale.926 people wrote nearly 49,000 words about their sex lives in an eight minute survey, and only nine gave nothing usable.
- The follow-ups found the why.They doubled the themes we could see and surfaced most of the relational detail that defines the sexual types.
- Open text can carry a driver model and a segmentation.Coded chat themes predicted sexual satisfaction as well as a five-item rating grid, and together they explained nearly two thirds of it.
- The method held across groups.The follow-ups added the same share of depth for 18 year olds and 80 year olds, men and women.
- Imperfect probing still worked.One in five probes from the 2021 rules engine was a mechanical echo and one in thirty a wrong guess. People still explained themselves, and corrected the bot when it got them wrong.
The last word
“It’s unfortunate you are a bot, you’ll never know, it’s just good.”Man, 55 to 64 · satisfaction 100 · from the sex toys chat
Notes on method
Source. Private Thoughts, ALC0421A Sexual Attitudes Survey. Online, Pureprofile panel, fielded 3 to 20 August 2021. Base n=926 completes, test entries excluded, unweighted. Quotas on age, gender and state.
Measures. “How having sex makes you feel” 0 to 100 scale (A2), reported as sexual satisfaction and used as the outcome throughout. Satisfied = 81 to 100 (n=407); unsatisfied = 0 to 40 (n=135). Five feelings about sex life (A3), activities (A1), frequency (D3), self-description (D5) and demographics. Partnered sex = sexually active in the last 3 months or answered the frequency question.
Text analysis. B1 conversations recoded in October 2026 by AI coders working to a written 28-theme codebook, blind to each person’s score (the bot’s playback of the score was removed before coding). Every quote is verbatim, checked against the transcript, with spelling kept. Quotes flagged as explicit or potentially identifying were excluded.
Driver model. Relative weights analysis (Johnson 2000) of sexual satisfaction on theme indicators with at least 15 mentions (10 within subgroups); 500 bootstrap resamples overall and 300 within subgroups for 90% intervals. The closed versus text comparison uses 10-fold cross-validated ridge regression.
Segmentation. Latent class model (Bernoulli mixture) on the 28 theme indicators, best of 25 starts for 3 to 10 classes. BIC favours fewer classes on sparse yes/no data; seven were chosen for interpretability, with mean assignment probability 0.79 to 0.90 per type. The release seekers type includes 45 people whose answers raised none of the 28 themes.
Age and gender. Age bands 18 to 34 (men n=108, women n=144), 35 to 54 (147, 161), 55 to 74 (130, 125), 75 and over (66, 45). The widening gap is tested with OLS of sexual satisfaction on gender × age, then adding partnered sex and being single; coefficients per decade with 95% intervals. Theme differences use two-proportion z-tests at p<0.05.
Photography. Images in this edition are AI-generated illustrations. They do not show respondents and are not documentary photographs. Photos 11 to 20 are working previews awaiting full-resolution versions.
Colophon
EVE Sexual Attitudes Study 2021, 5 year Redux, Directors Edition. Published by HumanListening and Evolved Thinking, October 2026. Display type in Bodoni Moda, text in Newsreader, captions in Jost.
Advertisement
EVE
Listen closer
EVE Qual Pro